Virtual Icechunk · IOOS Hackathon 2026
Visualizing Icechunk stores
From xarray in a notebook to a globe in the browser
Eli Holmes1
1NOAA Fisheries
Open a store in xarray
import icechunk, xarray as xr

url = "https://data.source.coop/ocean-icechunks/hycom/hycom-gofs-3pt1-reanalysis"
repo = icechunk.Repository.open(icechunk.http_storage(url))

# The data live in HYCOM's bucket, outside the store: allow reads from there.
auth = {p: icechunk.credentials.HttpAccess for p in repo.config.virtual_chunk_containers}
repo = repo.reopen(authorize_virtual_chunk_access=auth)

ds = xr.open_zarr(repo.readonly_session(tag="v1").store, consolidated=False, chunks=None)Then it is just xarray
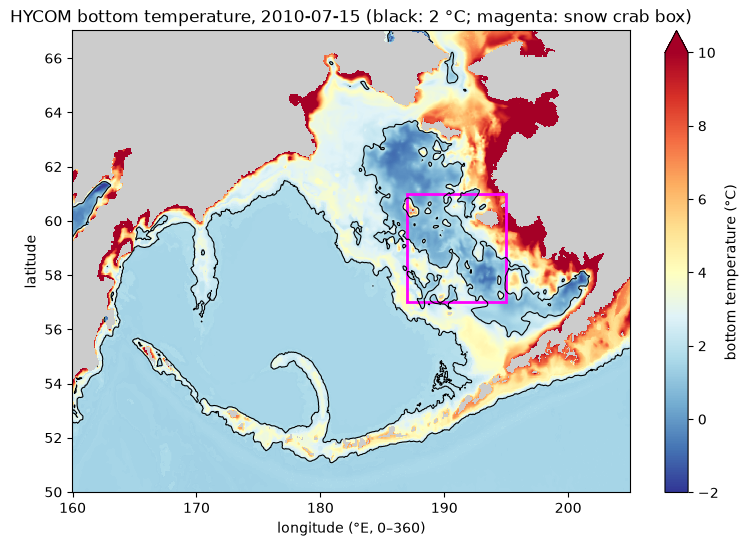
Bottom temperature in the Bering Sea, 15 July 2010, from the HYCOM store. The black line is 2 °C; the magenta box is the snow crab grounds.
Icechunk is built on Zarr
- Zarr is an open format for chunked arrays in object storage. Each chunk is fetched on its own, with a simple web request
- Icechunk stores Zarr arrays, and adds versions and commits on top
- So any Zarr reader with Icechunk support can open these stores, in any language, straight from the bucket. No server in between
| Where | Libraries |
|---|---|
| Python | icechunk + zarr + xarray, as in this tutorial |
| JavaScript (browsers) | zarrita + icechunk-js |
zarrita and icechunk-js
- zarrita reads Zarr arrays in JavaScript: in a web page or in Node. It fetches only the chunks a view needs
- icechunk-js reads an Icechunk repository and hands it to zarrita as a store, including virtual chunks that live in the original NetCDF files
gridlook: a store on a globe
gridlook is a WebGL viewer for Earth system model output, built on zarrita and icechunk-js. Give it a store’s URL, and it draws the data on a globe in your browser, with nothing to install.
Open the ocean acidification indicators in gridlook →
Axes but no data? The browser also needs CORS on the source host. NCEI and the NDVI bucket send it; HYCOM’s bucket on AWS does not.
That’s the tour
- Back to the start, and the Resources page
- Build your own: open a terminal, start your agent, and ask it for a plan
⌂ Home · Visualizing Icechunk stores